The R language provides tools for modeling and visualization, but is still an excellent tool for handling/preparing data. As C++ or python, there is some tricks that bring performance, make the code clean or both, but especially with R these choices can have a huge impact on performance and the “size” of your code. A seasoned R user can manage this effectively, but this can be a headache to a new user. SO, in this series of posts i will present some data preparation techniques that anyone should know about, at least the ones i know!
1. Using apply, lappy, tapply
Sometimes the apply’s can make your code faster, sometimes just cleaner. BUT the fact is that, at least in R, is recommended avoid for loops. So, instead of using loops, you can iterate over matrixes, lists and vectors using these functions. As an example see this code:
matriz <- matrix(round(runif(9,1,10),0),nrow=3)
apply(matriz, 1, sum) ## sum by row
apply(matriz, 2, sum) ## sum by column
Particularly in this example there is no gain on performance, but you get a cleaner code.
Talking about means, sometimes tapply can be very usefull in this regard. Let’s say you want to get means by group, you can have this with one line too. For example, considering the mtcars dataset:
mpg cyl  disp  hp drat    wt  qsec vs am gear carb
Mazda RX4           21.0   6 160.0 110 3.90 2.620 16.46  0  1    4    4
Mazda RX4 Wag       21.0   6 160.0 110 3.90 2.875 17.02  0  1    4    4
Datsun 710          22.8   4 108.0  93 3.85 2.320 18.61  1  1    4    1
Hornet 4 Drive      21.4   6 258.0 110 3.08 3.215 19.44  1  0    3    1
Hornet Sportabout   18.7   8 360.0 175 3.15 3.440 17.02  0  0    3    2
Valiant             18.1   6 225.0 105 2.76 3.460 20.22  1  0    3    1
Duster 360          14.3   8 360.0 245 3.21 3.570 15.84  0  0    3    4
Merc 240D           24.4   4 146.7  62 3.69 3.190 20.00  1  0    4    2
Merc 230            22.8   4 140.8  95 3.92 3.150 22.90  1  0    4    2
Merc 280            19.2   6 167.6 123 3.92 3.440 18.30  1  0    4    4
Merc 280C           17.8   6 167.6 123 3.92 3.440 18.90  1  0    4    4
Merc 450SE          16.4   8 275.8 180 3.07 4.070 17.40  0  0    3    3
Merc 450SL          17.3   8 275.8 180 3.07 3.730 17.60  0  0    3    3
Merc 450SLC         15.2   8 275.8 180 3.07 3.780 18.00  0  0    3    3
Cadillac Fleetwood  10.4   8 472.0 205 2.93 5.250 17.98  0  0    3    4
Lincoln Continental 10.4   8 460.0 215 3.00 5.424 17.82  0  0    3    4
Chrysler Imperial   14.7   8 440.0 230 3.23 5.345 17.42  0  0    3    4
Fiat 128            32.4   4  78.7  66 4.08 2.200 19.47  1  1    4    1
Honda Civic         30.4   4  75.7  52 4.93 1.615 18.52  1  1    4    2
Toyota Corolla      33.9   4  71.1  65 4.22 1.835 19.90  1  1    4    1
Toyota Corona       21.5   4 120.1  97 3.70 2.465 20.01  1  0    3    1
Dodge Challenger    15.5   8 318.0 150 2.76 3.520 16.87  0  0    3    2
AMC Javelin         15.2   8 304.0 150 3.15 3.435 17.30  0  0    3    2
Camaro Z28          13.3   8 350.0 245 3.73 3.840 15.41  0  0    3    4
Pontiac Firebird    19.2   8 400.0 175 3.08 3.845 17.05  0  0    3    2
Fiat X1-9           27.3   4  79.0  66 4.08 1.935 18.90  1  1    4    1
Porsche 914-2       26.0   4 120.3  91 4.43 2.140 16.70  0  1    5    2
Lotus Europa        30.4   4  95.1 113 3.77 1.513 16.90  1  1    5    2
Ford Pantera L      15.8   8 351.0 264 4.22 3.170 14.50  0  1    5    4
Ferrari Dino        19.7   6 145.0 175 3.62 2.770 15.50  0  1    5    6
Maserati Bora       15.0   8 301.0 335 3.54 3.570 14.60  0  1    5    8
Volvo 142E          21.4   4 121.0 109 4.11 2.780 18.60  1  1    4    2
so
tapply(mtcars$hp, mtcars$cyl, mean)
and you can have the mean power by cylinder capacity. This function is very usefull on descriptive analysis. BUT sometimes you have lists, not vectors. In this case just use lappy or sapply (simplify the output). Let’s generate some data:
lista <- list(a=c('one', 'tow', 'three'), b=c(1,2,3), c=c(12, 'a'))
Each element of this list is a vector. Let’s say you want to know how many elements there is in each vector:
lapply(lista, length) ## return a list
sapply(lista, length) ## coerce to a vector
$a
[1] 3

$b
[1] 3

$c
[1] 2
a b c
3 3 2
2. Split, apply and recombine
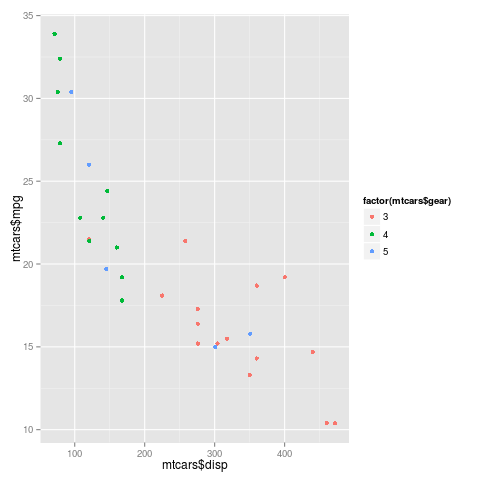
This technique you must know. Basically we split the data, apply a function and combine the results. There is a package created with this in mind. But we will use just base R functions: split, *apply and cbind() ou rbind() when needed. Looking again at mtcars dataset, let’s say we want fit a model of mpg against disp, grouped by gears, and compare the regression coefficients.

data <- split(mtcars, mtcars$gear) ## split
fits <- lapply(data, function(x) return(lm(x$mpg~x$disp)$coef)) ## apply
do.call(rbind, fits) ## recombine
  (Intercept)      x$disp
3    24.51557 -0.02577046
4    39.56753 -0.12221268
5    31.66095 -0.05077512
This technique is powerfull. You can use at different contexts.
Next part i will talk about some tricks with dates.
[…] The R language provides tools for modeling and visualization, but is still an excellent tool for handling/preparing data. […]